Chapter 19Project: A Paint Program
I look at the many colors before me. I look at my blank canvas. Then, I try to apply colors like words that shape poems, like notes that shape music.
The material from the previous chapters gives you all the elements you need to build a simple web application. In this chapter, we will do just that.
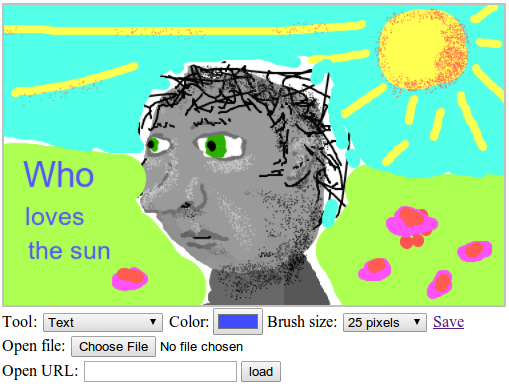
Our application will be a web-based drawing program, along the lines of Microsoft Paint. You can use it to open image files, scribble on them with your mouse, and save them. This is what it will look like:
Painting on a computer is great. You don’t need to worry about materials, skill, or talent. You just start smearing.
Implementation
The
interface for the paint program shows a big <canvas> element on top,
with a number of form fields below it. The user draws on the
picture by selecting a tool from a <select> field and then
clicking or dragging across the canvas. There are tools for
drawing lines, erasing parts of the picture, adding text, and so on.
Clicking the canvas will hand off the
"mousedown" event to the currently selected tool, which can handle
it in whichever way it chooses. The line drawing tool, for
example, will listen for "mousemove" events until the mouse button
is released and draw lines along the mouse’s path using the current
color and brush size.
Color and brush size are selected with
additional form fields. These are hooked up to update the canvas
drawing context’s fillStyle, strokeStyle, and lineWidth whenever
they are changed.
You can load an image into the program in two ways. The first uses a file field, where the user can select a file on their own file system. The second asks for a URL and will fetch an image from the Web.
Images are saved in a somewhat atypical way. The save link at the right side points at the current image. It can be followed, shared, or saved. I will explain how this is achieved in a moment.
Building the DOM
Our program’s interface is built from more than 30 DOM elements. We need to construct these somehow.
HTML is the
most obvious format for defining complex DOM structures. But
separating the program into a piece of HTML and a script is made
difficult by the fact that many of the DOM elements need event
handlers or have to be touched by the script in some other way. Thus,
our script would have to make lots of querySelector (or similar)
calls in order to find the DOM elements that it needs to act on.
It would be nice if the DOM structure for each part of our interface is defined close to the JavaScript code that drives it. Thus, I’ve chosen to do all creation of DOM nodes in JavaScript. As we saw in Chapter 13, the built-in interface for building up a DOM structure is horrendously verbose. If we are going to do a lot of DOM construction, we need a helper function.
This helper function is an extended version of the
elt function from Chapter 13. It creates an
element with the given name and attributes and appends all
further arguments it gets as child nodes, automatically converting
strings to text nodes.
function elt(name, attributes) {
  var node = document.createElement(name);
  if (attributes) {
    for (var attr in attributes)
      if (attributes.hasOwnProperty(attr))
        node.setAttribute(attr, attributes[attr]);
  }
  for (var i = 2; i < arguments.length; i++) {
    var child = arguments[i];
    if (typeof child == "string")
      child = document.createTextNode(child);
    node.appendChild(child);
  }
  return node;
}
This allows us to create elements easily, without making our source code as long and dull as a corporate end-user agreement.
The foundation
The core of our program
is the createPaint function, which appends the paint interface to
the DOM element it is given as an argument. Because we want to build our
program piece by piece, we define an object called controls, which will
hold functions to initialize the various controls below the image.
var controls = Object.create(null);

function createPaint(parent) {
  var canvas = elt("canvas", {width: 500, height: 300});
  var cx = canvas.getContext("2d");
  var toolbar = elt("div", {class: "toolbar"});
  for (var name in controls)
    toolbar.appendChild(controls[name](cx));

  var panel = elt("div", {class: "picturepanel"}, canvas);
  parent.appendChild(elt("div", null, panel, toolbar));
}
Each control has access to the canvas
drawing context and, through that context’s canvas property, to the
<canvas> element. Most of the program’s state lives in this
canvas—it contains the current picture as well as the selected color
(in its fillStyle property) and brush size (in its lineWidth
property).
We wrap the canvas and the controls in
<div> elements with classes so we can add some styling, such as
a gray border around the picture.
Tool selection
The first control we add is the <select> element that
allows the user to pick a drawing tool. As with controls, we
will use an object to collect the various tools so that we do not
have to hard-code them all in one place and can add more tools later.
This object associates the names of the tools with the function that
should be called when they are selected and the canvas is clicked.
var tools = Object.create(null);

controls.tool = function(cx) {
  var select = elt("select");
  for (var name in tools)
    select.appendChild(elt("option", null, name));

  cx.canvas.addEventListener("mousedown", function(event) {
    if (event.which == 1) {
      tools[select.value](event, cx);
      event.preventDefault();
    }
  });

  return elt("span", null, "Tool: ", select);
};
The tool field is populated with
<option> elements for all tools that have been defined, and a
"mousedown" handler on the canvas element takes care of calling the
function for the current tool, passing it both the event object
and the drawing context as arguments. It also calls
preventDefault so that holding the mouse button and dragging does
not cause the browser to select parts of the page.
The most basic
tool is the line tool, which allows the user to draw lines with
the mouse. To put the line ends in the right place, we
need to be able to find the canvas-relative coordinates that a
given mouse event corresponds to. The getBoundingClientRect method,
briefly mentioned in Chapter 13, can
help us here. It tells us where an element is shown, relative to the
top-left corner of the screen. The clientX and clientY properties
on mouse events are also relative to this corner, so we can subtract
the top-left corner of the canvas from them to get a position relative
to that corner.
function relativePos(event, element) {
  var rect = element.getBoundingClientRect();
  return {x: Math.floor(event.clientX - rect.left),
          y: Math.floor(event.clientY - rect.top)};
}
Several of the drawing tools need to listen for
"mousemove" events as long as the mouse button is held down. The
trackDrag function takes care of the event registration and
unregistration for such situations.
function trackDrag(onMove, onEnd) {
  function end(event) {
    removeEventListener("mousemove", onMove);
    removeEventListener("mouseup", end);
    if (onEnd)
      onEnd(event);
  }
  addEventListener("mousemove", onMove);
  addEventListener("mouseup", end);
}
This function takes two arguments. One is a function to call for each
"mousemove" event, and the other is a function to call when the
mouse button is released. Either argument can be omitted when it
is not needed.
The line tool uses these two helpers to do the actual drawing.
tools.Line = function(event, cx, onEnd) {
  cx.lineCap = "round";

  var pos = relativePos(event, cx.canvas);
  trackDrag(function(event) {
    cx.beginPath();
    cx.moveTo(pos.x, pos.y);
    pos = relativePos(event, cx.canvas);
    cx.lineTo(pos.x, pos.y);
    cx.stroke();
  }, onEnd);
};
The function starts by setting the drawing
context’s lineCap property to "round", which causes both ends of
a stroked path to be round rather than the default square form.
This is a trick to make sure that multiple separate lines, drawn in
response to separate events, look like a single, coherent line. With
bigger line widths, you will see gaps at corners if you use the default flat
line caps.
Then, for every "mousemove" event that occurs as long as
the mouse button is down, a simple line segment is drawn between the
mouse’s old and new position, using whatever strokeStyle and
lineWidth happen to be currently set.
The onEnd argument to tools.Line is simply passed
through to trackDrag. The normal way to run tools won’t pass a third
argument, so when using the line tool, that argument will hold
undefined, and nothing happens at the end of the mouse drag. The
argument is there to allow us to implement the erase tool on top of
the line tool with very little additional code.
tools.Erase = function(event, cx) {
  cx.globalCompositeOperation = "destination-out";
  tools.Line(event, cx, function() {
    cx.globalCompositeOperation = "source-over";
  });
};
The globalCompositeOperation property influences the way
drawing operations on a canvas change the color of the pixels they
touch. By default, the property’s value is "source-over", which means that the drawn
color is overlaid on the existing color at that spot. If the color is
opaque, it will simply replace the old color, but if it is
partially transparent, the two will be mixed.
The erase tool sets globalCompositeOperation to
"destination-out", which has the effect of erasing the pixels we
touch, making them transparent again.
That gives us two tools in our paint program. We can draw
black lines a single pixel wide (the default strokeStyle and
lineWidth for a canvas) and erase them again. It is a working,
albeit rather limited, paint program.
Color and brush size
Assuming that users will want to draw in colors other than black and use different brush sizes, let’s add controls for those two settings.
In
Chapter 18, I discussed a number of
different form fields. Color fields were not among those.
Traditionally, browsers don’t have built-in support for color
pickers, but in the past few years, a number of new form field types have
been standardized. One of those is <input type="color">. Others
include "date", "email", "url", and "number". Not all
browsers support them yet—at the time of writing, no version of
Internet Explorer supports color fields. The default type of
an <input> tag is "text", and when an unsupported type is used,
browsers will treat it as a text field. This means that Internet
Explorer users running our paint program will have to type in the name
of the color they want, rather than select it from a convenient
widget.
controls.color = function(cx) {
  var input = elt("input", {type: "color"});
  input.addEventListener("change", function() {
    cx.fillStyle = input.value;
    cx.strokeStyle = input.value;
  });
  return elt("span", null, "Color: ", input);
};
Whenever the value of the color field changes, the drawing
context’s fillStyle and strokeStyle are updated to hold the new
value.
The field for configuring the brush size works similarly.
controls.brushSize = function(cx) {
  var select = elt("select");
  var sizes = [1, 2, 3, 5, 8, 12, 25, 35, 50, 75, 100];
  sizes.forEach(function(size) {
    select.appendChild(elt("option", {value: size},
                           size + " pixels"));
  });
  select.addEventListener("change", function() {
    cx.lineWidth = select.value;
  });
  return elt("span", null, "Brush size: ", select);
};
The code generates options from an array of brush
sizes, and again ensures that the canvas’ lineWidth is updated when
a brush size is chosen.
Saving
To explain the implementation of the save link, I must first tell you about data URLs. A data URL is a URL with data: as its protocol. Unlike regular http: and https: URLs, data URLs don’t point at a resource but rather contain the entire resource in them. This is a data URL containing a simple HTML document:
data:text/html,<h1 style="color:red">Hello!</h1>
Data URLs are useful for various tasks, such as including small images directly in a style sheet file. They also allow us to link to files that we created on the client side, in the browser, without first moving them to some server.
Canvas elements have a convenient method, called toDataURL,
which will return a data URL that contains the picture on the canvas
as an image file. We don’t want to update our save link every time
the picture is changed, however. For big pictures, that involves moving
quite a lot of data into a link and would be noticeably slow.
Instead, we rig the link to update its href attribute whenever it is
focused with the keyboard or the mouse is moved over it.
controls.save = function(cx) {
  var link = elt("a", {href: "/"}, "Save");
  function update() {
    try {
      link.href = cx.canvas.toDataURL();
    } catch (e) {
      if (e instanceof SecurityError)
        link.href = "javascript:alert(" +
          JSON.stringify("Can't save: " + e.toString()) + ")";
      else
        throw e;
    }
  }
  link.addEventListener("mouseover", update);
  link.addEventListener("focus", update);
  return link;
};
Thus, the link just quietly sits there, pointing at the wrong thing, but when the user approaches it, it magically updates itself to point at the current picture.
If you load a big image, some browsers will choke on the giant data URLs that this produces. For small pictures, this approach works without problem.
But here we once again run into the subtleties of browser sandboxing. When an image is loaded from a URL on another domain, if the server’s response doesn’t include a header that tells the browser the resource may be used from other domains (see Chapter 17), then the canvas will contain information that the user may look at but that the script may not.
We may have requested a picture that contains private information (for example, a graph showing the user’s bank account balance) using the user’s session. If scripts could get information out of that picture, they could snoop on the user in undesirable ways.
To prevent these kinds of information leaks, browsers will mark a canvas as tainted when an image that the script may not see is drawn onto it. Pixel data, including data URLs, may not be extracted from a tainted canvas. You can write to it, but you can no longer read it.
This is why we need the
try/catch statement in the update function for the save link.
When the canvas has become tainted, calling toDataURL will raise an
exception that is an instance of SecurityError. When that happens, we
set the link to point at yet another kind of URL, using the
javascript: protocol. Such links simply execute the script given
after the colon when they are followed so that the link will show an
alert window informing the user of the problem when it is clicked.
Loading image files
The final two controls are used to load images from local files and from URLs. We’ll need the following helper function, which tries to load an image file from a URL and replace the contents of the canvas with it:
function loadImageURL(cx, url) {
  var image = document.createElement("img");
  image.addEventListener("load", function() {
    var color = cx.fillStyle, size = cx.lineWidth;
    cx.canvas.width = image.width;
    cx.canvas.height = image.height;
    cx.drawImage(image, 0, 0);
    cx.fillStyle = color;
    cx.strokeStyle = color;
    cx.lineWidth = size;
  });
  image.src = url;
}
We want to change the
size of the canvas to precisely fit the image. For some reason,
changing the size of a canvas will cause its drawing context to forget
configuration properties such as fillStyle and lineWidth, so the
function saves those and restores them after it has updated the canvas
size.
The control for loading
a local file uses the FileReader technique from
Chapter 18. Apart from the readAsText
method we used there, such reader objects also have a method called
readAsDataURL, which is exactly what we need here. We load the
file that the user chose as a data URL and pass it to
loadImageURL to put it into the canvas.
controls.openFile = function(cx) {
  var input = elt("input", {type: "file"});
  input.addEventListener("change", function() {
    if (input.files.length == 0) return;
    var reader = new FileReader();
    reader.addEventListener("load", function() {
      loadImageURL(cx, reader.result);
    });
    reader.readAsDataURL(input.files[0]);
  });
  return elt("div", null, "Open file: ", input);
};
Loading a file from a URL is even simpler. But with a text field, it is less clear when the user has finished writing the URL,
so we can’t simply listen for "change" events. Instead, we will wrap
the field in a form and respond when the form is submitted, either
because the user pressed Enter or because they clicked the load
button.
controls.openURL = function(cx) {
  var input = elt("input", {type: "text"});
  var form = elt("form", null,
                 "Open URL: ", input,
                 elt("button", {type: "submit"}, "load"));
  form.addEventListener("submit", function(event) {
    event.preventDefault();
    loadImageURL(cx, input.value);
  });
  return form;
};
We have now defined all the controls that our simple paint program needs, but it could still use a few more tools.
Finishing up
We can easily add a text tool that
uses prompt to ask the user which string it should draw.
tools.Text = function(event, cx) {
  var text = prompt("Text:", "");
  if (text) {
    var pos = relativePos(event, cx.canvas);
    cx.font = Math.max(7, cx.lineWidth) + "px sans-serif";
    cx.fillText(text, pos.x, pos.y);
  }
};
You could add extra fields for the font size and the font, but for simplicity’s sake, we always use a sans-serif font and base the font size on the current brush size. The minimum size is 7 pixels because text smaller than that is unreadable.
Another indispensable tool for drawing amateurish computer graphics is the spray paint tool. This one draws dots in random locations under the brush as long as the mouse is held down, creating denser or less dense speckling based on how fast or slow the mouse moves.
tools.Spray = function(event, cx) {
  var radius = cx.lineWidth / 2;
  var area = radius * radius * Math.PI;
  var dotsPerTick = Math.ceil(area / 30);

  var currentPos = relativePos(event, cx.canvas);
  var spray = setInterval(function() {
    for (var i = 0; i < dotsPerTick; i++) {
      var offset = randomPointInRadius(radius);
      cx.fillRect(currentPos.x + offset.x,
                  currentPos.y + offset.y, 1, 1);
    }
  }, 25);
  trackDrag(function(event) {
    currentPos = relativePos(event, cx.canvas);
  }, function() {
    clearInterval(spray);
  });
};
The spray tool uses
setInterval to spit out colored dots every 25 milliseconds as long
as the mouse button is held down. The trackDrag function is used to
keep currentPos pointing at the current mouse position and to turn
off the interval when the mouse button is released.
To determine how many dots to draw every time the interval fires, the
function computes the area of the current brush and divides that
by 30. To find a random position under the brush, the randomPointInRadius
function is used.
function randomPointInRadius(radius) {
  for (;;) {
    var x = Math.random() * 2 - 1;
    var y = Math.random() * 2 - 1;
    if (x * x + y * y <= 1)
      return {x: x * radius, y: y * radius};
  }
}
This function generates points in the square between (-1,-1)
and (1,1). Using the Pythagorean theorem, it tests whether the generated point lies within a circle
of radius 1. As soon as the function finds such a point, it returns the point
multiplied by the radius argument.
The loop
is necessary for a uniform distribution of dots. The straightforward way
of generating a random point within a circle would be to use a random angle and distance and
call Math.sin and Math.cos to create the corresponding point. But with that method,
the dots are more likely to appear near the center of the circle.
There are other ways around that, but they’re more complicated than the previous loop.
We now have a functioning paint program. Run the code below to try it.
<link rel="stylesheet" href="css/paint.css">

<body>
  <script>createPaint(document.body);</script>
</body>
Exercises
There is still plenty of room for improvement in this program. Let’s add a few more features as exercises.
Rectangles
Define a tool
called Rectangle that fills a rectangle (see the fillRect method
from Chapter 16) with the current
color. The rectangle should span from the point where the user pressed
the mouse button to the point where they released it. Note that
the latter might be above or to the left of the former.
Once it works, you’ll notice that it is somewhat jarring to not see the rectangle as you are dragging the mouse to select its size. Can you come up with a way to show some kind of rectangle during the dragging, without actually drawing to the canvas until the mouse button is released?
If nothing comes to mind, think back to the position:
absolute style discussed in
Chapter 13, which can be used to overlay a
node on the rest of the document. The pageX and pageY properties
of a mouse event can be used to position an element precisely under
the mouse, by setting the left, top, width, and height styles
to the correct pixel values.
<script>
  tools.Rectangle = function(event, cx) {
    // Your code here.
  };
</script>

<link rel="stylesheet" href="css/paint.css">
<body>
  <script>createPaint(document.body);</script>
</body>
You can use relativePos to find the corner
corresponding to the start of the mouse drag. Figuring out where the
drag ends can be done with trackDrag or by registering your own
event handler.
When you have two corners of the rectangle, you must
somehow translate these into the arguments that fillRect expects:
the top-left corner, width, and height of the rectangle. Math.min
can be used to find the leftmost x-coordinate and topmost
y-coordinate. To get the width or height, you can call Math.abs (the
absolute value) on the difference between two sides.
Showing the rectangle during the mouse drag requires
a similar set of numbers but in the context of the whole page rather
than relative to the canvas. Consider writing a function findRect,
which converts two points into an object with top, left, width,
and height properties so that you don’t have to write the same
logic twice.
You can then create a <div> node and set its
style.position to absolute. When setting positioning styles, do
not forget to append "px" to the numbers. The node must be added to
the document (you can append it to document.body) and also removed
again when the drag ends and the actual rectangle gets drawn onto the
canvas.
Color picker
Another tool that is commonly found in graphics programs is a color picker, which allows the user to click the picture and selects the color under the mouse pointer. Build this.
For
this tool, we need a way to access the content of the canvas. The
toDataURL method more or less did that, but getting pixel
information out of such a data URL is hard. Instead, we’ll use the
getImageData method on the drawing context, which returns a
rectangular piece of the image as an object with width, height,
and data properties. The data property holds an array of numbers
from 0 to 255, using four numbers to represent each pixel’s red,
green, blue, and alpha (opaqueness) components.
This example retrieves the numbers for a single pixel from a canvas once when the canvas is blank (all pixels are transparent black) and once when the pixel has been colored red.
function pixelAt(cx, x, y) {
  var data = cx.getImageData(x, y, 1, 1);
  console.log(data.data);
}

var canvas = document.createElement("canvas");
var cx = canvas.getContext("2d");
pixelAt(cx, 10, 10);
// → [0, 0, 0, 0]

cx.fillStyle = "red";
cx.fillRect(10, 10, 1, 1);
pixelAt(cx, 10, 10);
// → [255, 0, 0, 255]
The arguments to getImageData indicate the starting x- and
y-coordinates of the rectangle we want to retrieve, followed by its
width and height.
Ignore transparency during this exercise and look
only at the first three values for a given pixel. Also, do not worry
about updating the color field when the user picks a color. Just make
sure that the drawing context’s fillStyle and strokeStyle are set
to the color under the mouse cursor.
Remember that these properties accept any color that
CSS understands, which includes the rgb(R, G, B) style you saw in
Chapter 15.
The
getImageData method is subject to the same restrictions as
toDataURL—it will raise an error when the canvas contains pixels
that originate from another domain. Use a try/catch statement to
report such errors with an alert dialog.
<script>
  tools["Pick color"] = function(event, cx) {
    // Your code here.
  };
</script>

<link rel="stylesheet" href="css/paint.css">
<body>
  <script>createPaint(document.body);</script>
</body>
You’ll again need to use relativePos to find out which
pixel was clicked. The pixelAt function in the example demonstrates how to get
the values for a given pixel. Putting those into an rgb string
merely requires some string concatenation.
Make sure you verify
that the exception you catch is an instance of SecurityError so
that you don’t accidentally handle the wrong kind of exception.
Flood fill
This is a more advanced exercise than the preceding two, and it will require you to design a nontrivial solution to a tricky problem. Make sure you have plenty of time and patience before starting to work on this exercise, and do not get discouraged by initial failures.
A flood fill tool colors the pixel under the mouse and the surrounding pixels of the same color. For the purpose of this exercise, we will consider such a group to include all pixels that can be reached from our starting pixel by moving in single-pixel horizontal and vertical steps (not diagonal), without ever touching a pixel that has a color different from the starting pixel.
The following image illustrates the set of pixels colored when the flood fill tool is used at the marked pixel:

The flood fill does not leak through diagonal gaps and does not touch pixels that are not reachable, even if they have the same color as the target pixel.
You will once again need
getImageData to find out the color for each pixel. It is
probably a good idea to fetch the whole image in one go and then pick
out pixel data from the resulting array. The pixels are organized in
this array in a similar way to the grid elements in
Chapter 7, one row at a time, except that
each pixel is represented by four values. The first value for the
pixel at (x,y) is at position (x + y × width) × 4.
Do include the fourth (alpha) value this time since we want to be able to tell the difference between empty and black pixels.
Finding all adjacent pixels with the same color requires you to “walk” over the pixel surface, one pixel up, down, left, or right, as long as new same-colored pixels can be found. But you won’t find all pixels in a group on the first walk. Rather, you have to do something similar to the backtracking done by the regular expression matcher, described in Chapter 9. Whenever more than one possible direction to proceed is seen, you must store all the directions you do not take immediately and look at them later, when you finish your current walk.
In a normal-sized picture, there are a lot of pixels. Thus, you must take care to do the minimal amount of work required or your program will take a very long time to run. For example, every walk must ignore pixels seen by previous walks so that it does not redo work that has already been done.
I recommend calling fillRect for individual
pixels when a pixel that should be colored is found, and keeping some
data structure that tells you about all the pixels that have already
been looked at.
<script>
  tools["Flood fill"] = function(event, cx) {
    // Your code here.
  };
</script>

<link rel="stylesheet" href="css/paint.css">
<body>
  <script>createPaint(document.body);</script>
</body>
Given a pair of starting coordinates and the image data for the whole canvas, this approach should work:
-
Create an array to hold information about already colored coordinates.
-
Create a work list array to hold coordinates that must be looked at. Put the start position in it.
-
If those coordinates are already in our array of colored pixels, go back to step 3.
-
Color the pixel at the current coordinates and add the coordinates to the array of colored pixels.
-
Add the coordinates of each adjacent pixel whose color is the same as the starting pixel’s original color to the work list.
The work list can simply be an array of vector objects. The data structure that tracks colored pixels will be consulted very often. Searching through the whole thing every time a new pixel is visited will take a lot of time. You could instead create an array that has a value in it for every pixel, using again the x + y × width scheme for associating positions with pixels. When checking whether a pixel has been colored already, you could directly access the field corresponding to the current pixel.
You can compare colors by running over the relevant part of the data array, comparing one field at a time. Or you can “condense” a color to a single number or string and compare those. When doing this, ensure that every color produces a unique value. For example, simply adding the color’s components is not safe since multiple colors will have the same sum.
When enumerating the neighbors of a given point, take care to exclude neighbors that are not inside of the canvas or your program might run off into one direction forever.